 EN
 FR
Road Sign Classification
Four deep learning architectures compared on the 43 classes of the GTSRB benchmark, then stress-tested under noise, motion blur and occlusion: 99.4% accuracy after Optuna tuning, and 99.5% under degraded conditions after adversarial retraining. Backed by Grad-CAM interpretability. The computer-vision foundation of ADAS systems.
mriusero/road-sign-classificationA deep learning project focused on classifying road signs using the GTSRB dataset. This repository includes data augmentation, model optimization, and regularization techniques, featuring both CNN and ResNet-inspired architectures tested under diverse conditions.The subject
Recognizing a road sign is easy in the lab and hard on the road: rain, motion blur, a sign half hidden by a truck. For an ADAS building block, the real question is not accuracy on a clean test set, but how much performance survives once conditions degrade. This project compares four architectures on the GTSRB benchmark, then measures what each one loses in real-world conditions.
The data
- GTSRB, the German reference benchmark: 12,630 images, 43 sign classes, with shape, color and pictogram metadata.
- Resizing to 64 × 64 RGB, normalization, one-hot encoding and a 70/15/15 split (8,841 / 1,894 / 1,895 images).
- 5× augmentation of the training set through rotation, flipping, zoom and cropping, for 44,205 images that force generalization.
The architectures compared
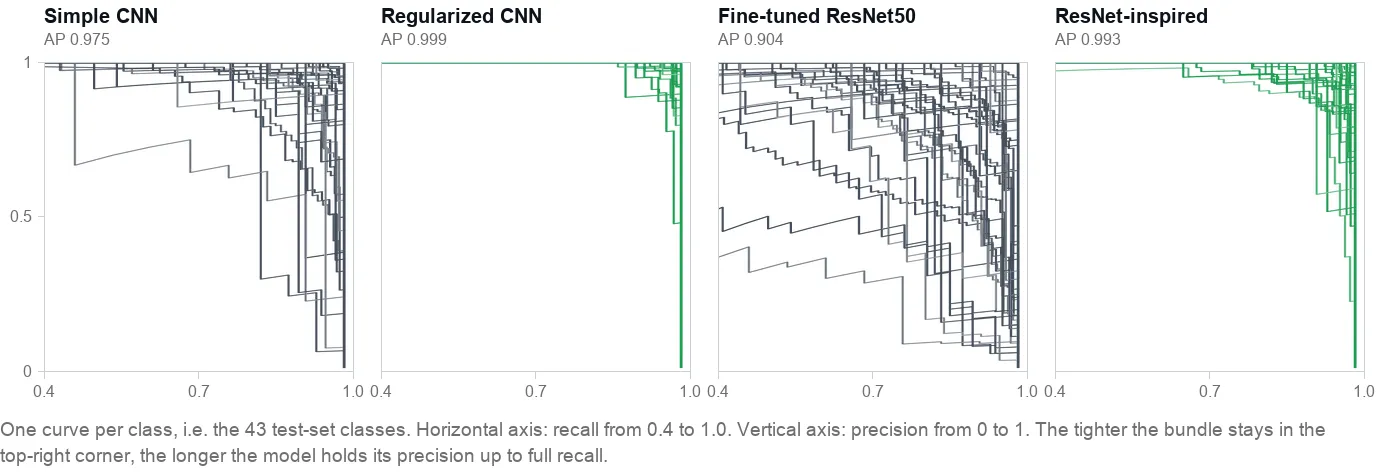
Four models trained under the same protocol, judged on per-class F1-score, AUC-ROC and average precision:
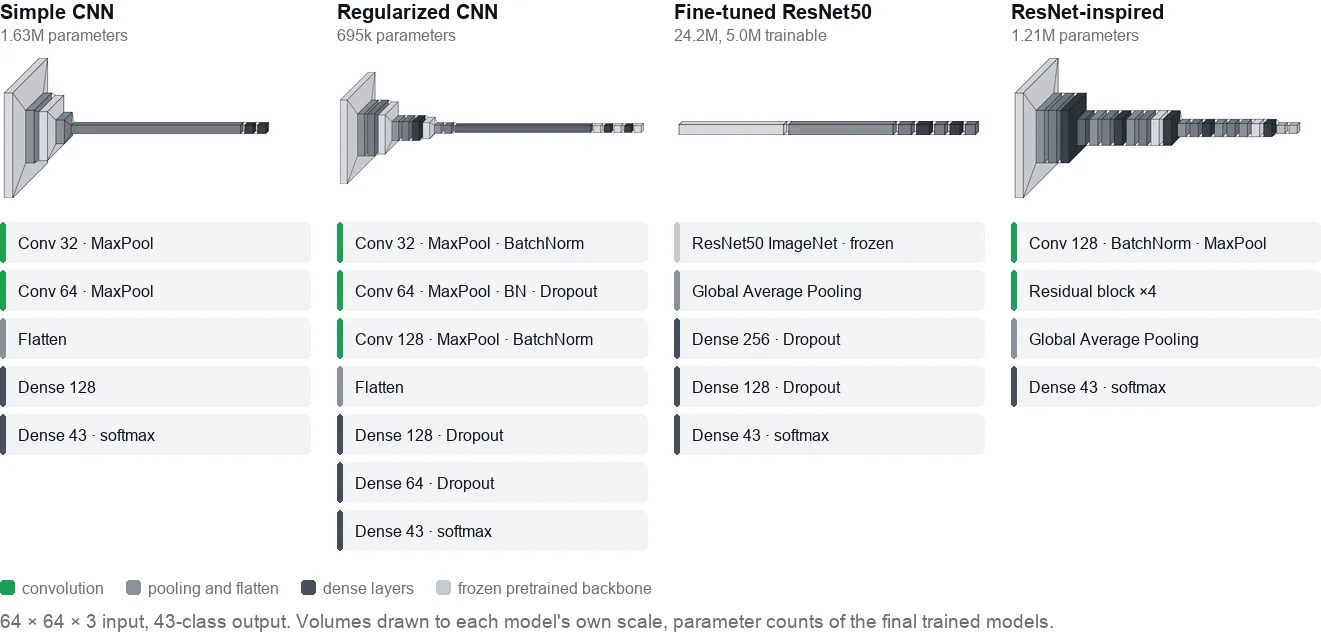
- Simple CNN: 93.9% F1 (AUC-ROC 0.9988). The lower baseline.
- Regularized CNN (Dropout, Batch Normalization): 98.6% F1 (AUC-ROC 0.9999). The best performance-to-compute ratio, at 695k parameters against 24.2M for ResNet50.
- Fine-tuned ResNet50: 84.2% F1. Transfer learning from ImageNet breaks down here: with 64 × 64 inputs, ResNet50 collapses the image into a 2 × 2 feature map before classification and loses the pictogram detail.
- ResNet-inspired model, four residual blocks trained from scratch: 94.6% F1 (AUC-ROC 0.9996).
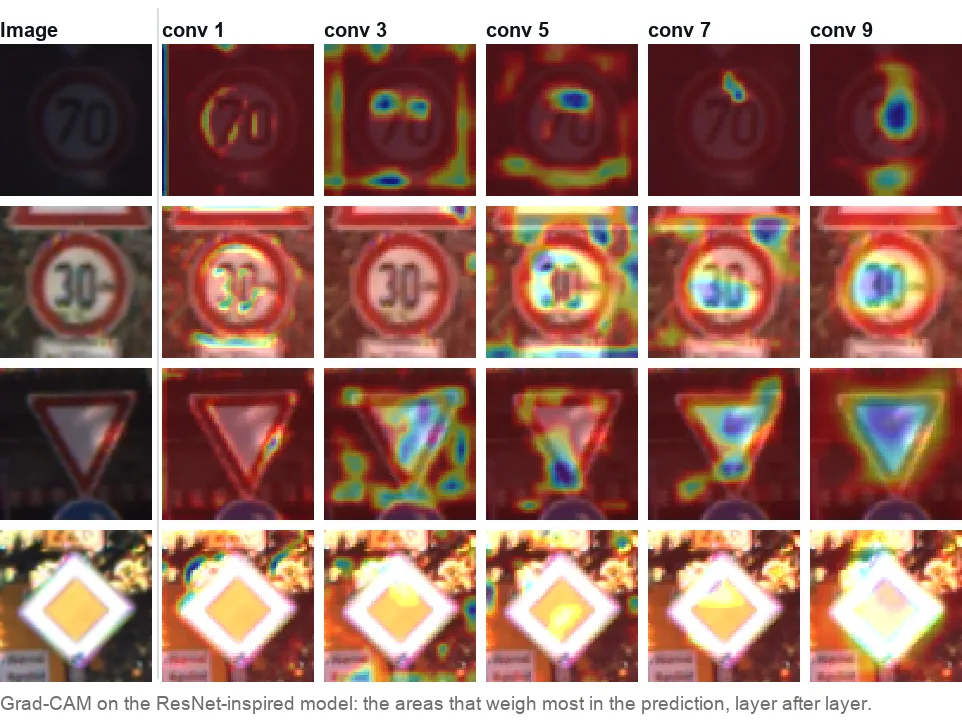
The two best candidates then go through a 100-trial Optuna search (learning rate, batch size, dropout rates, residual depth) with early stopping: the ResNet-inspired model reaches 99.4% accuracy and the regularized CNN 98.2%. Grad-CAM and layer-by-layer activations confirm the decision concentrates on the pictogram and its contours rather than the background, and pinpoint the residual errors: speed limits for the regularized CNN, graphically similar warning signs for the ResNet-inspired model.
Averages hide the spread, though: read class by class, the precision-recall curve clearly separates a model that holds all 43 classes from one that only holds most of them.
Robustness under degraded conditions
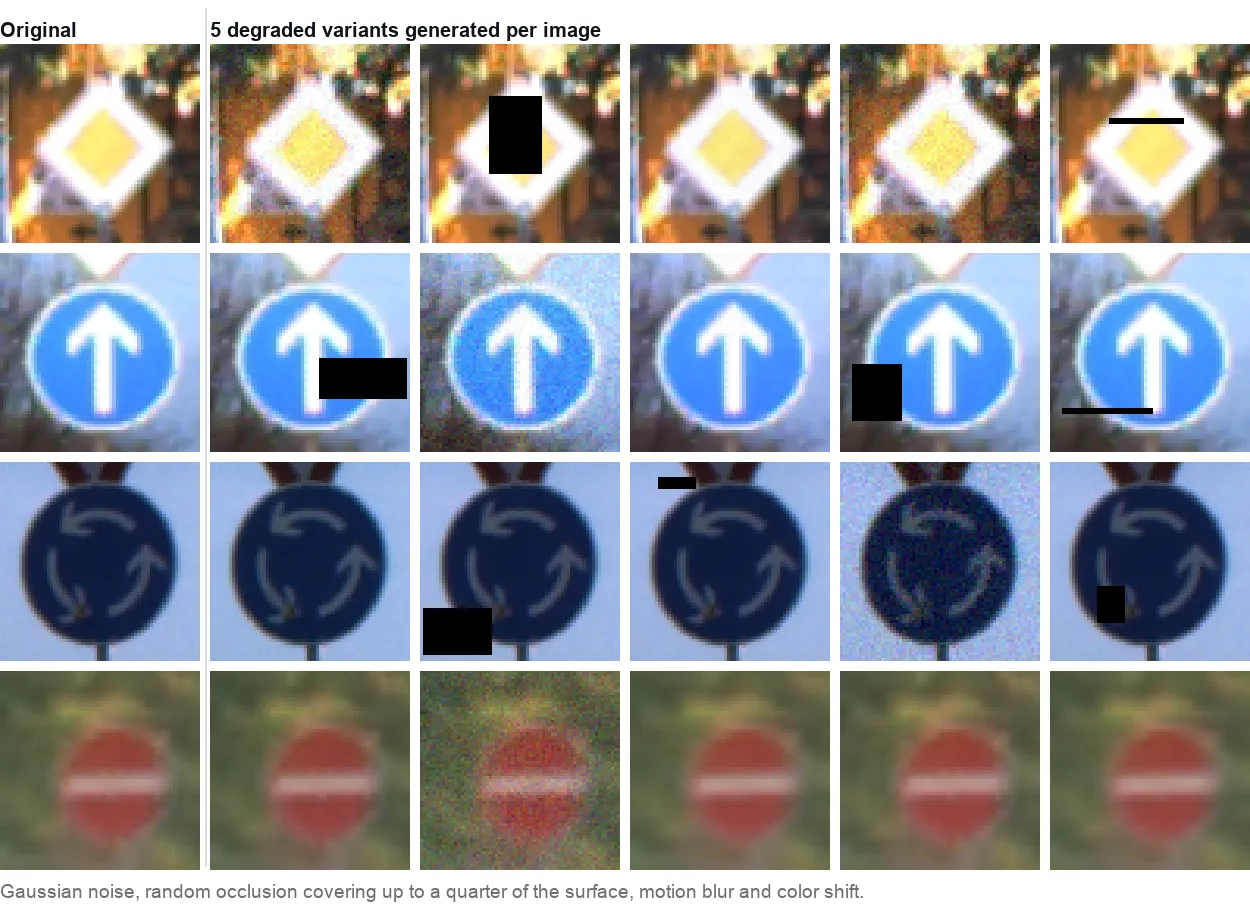
The test set is replayed in a degraded version: Gaussian noise, motion blur, color shift and random occlusion masking up to a quarter of the sign surface, for 9,475 perturbed images.
- Without adaptation, performance drops: 94.4% accuracy for the ResNet-inspired model, 92.2% for the regularized CNN.
- Retrained on the adversarial data, they climb back to 99.5% and 98.7%, with 0.999 average precision.
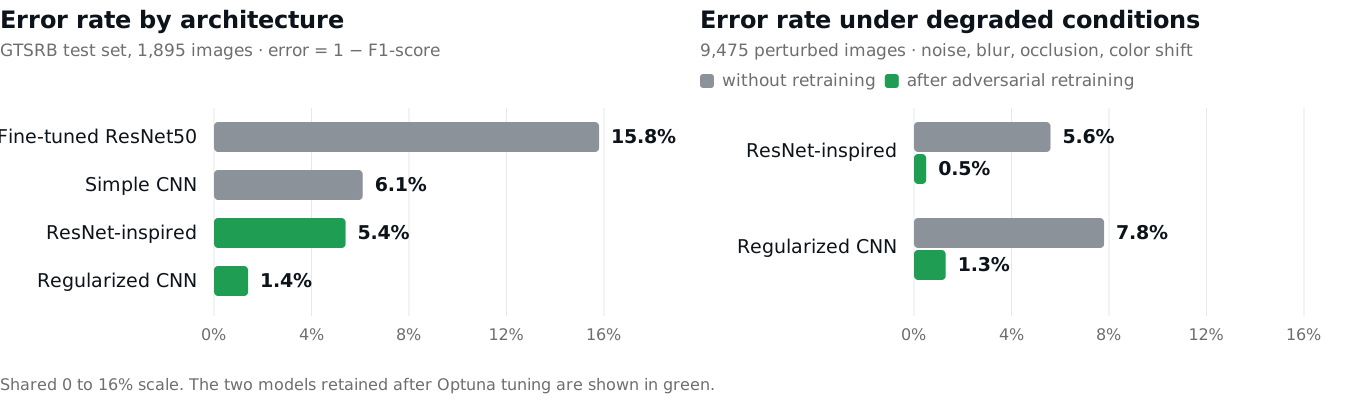
The degradation gap settles the choice between the two finalists: the ResNet-inspired model absorbs noise better, while the regularized CNN remains the right pick for a compute-constrained embedded target.
What the project demonstrates
An evaluation protocol that goes beyond lab accuracy: per-class metrics, adversarial tests calibrated on field conditions, interpretability to check what the model actually looks at, and an architecture decision argued from numbers rather than from model complexity. Training quality drives final performance more than network depth does. The same reflexes, stress sets built from real failure modes and metrics that localize weaknesses instead of averaging them away, are how evaluating LLM systems in production is done today.